Product Description
TrendReader® 2 is a powerful, versatile, and easy-to-use graphing software package designed exclusively for ACR’s SmartReader Plus, SmartReader, IAQ, Conservation, OWL, Nautilus, TRH and JR data loggers. Powerful features and easy setup enables logged data to be collected and thoroughly analyzed in seconds.
The software is for use with all SmartReader, SmartReader Plus, IAQ, OWL, TRH, JR and Nautilis data loggers.
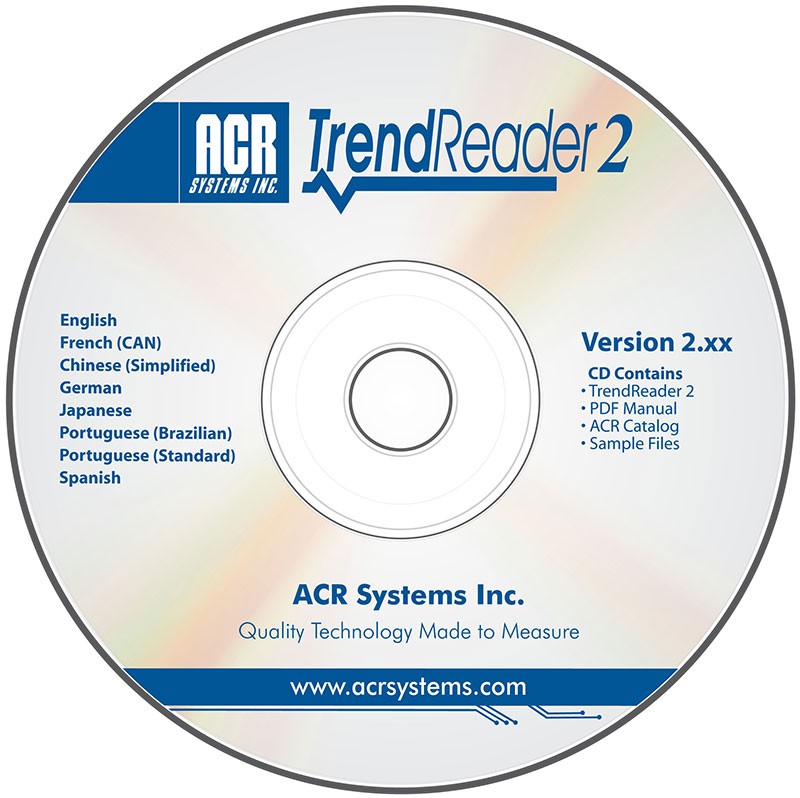
TrendReader 2 supports multiple languages including: English, French (Canadian), Chinese (Simplified), German, Japanese, Portuguese (Brazilian), Portuguese (Standard), Spanish.
TrendReader® 2 is compatible with Windows XP, Windows Vista 32 bit / 64 bit, Windows 7 32 bit / 64 bit
TrendReader 2 Software Trial
A fully functional 30 day trial version of TrendReader 2 (Version 2.36) is available from ACR Systems.
Key Features
- downloads and easy logger setup
- driver based
- One-touch table views
- copy and paste to other programs
- Fast overlay of data from different files
- drag and drop
- Presentation-quality graphs
- fixed comments and data labels
- Export capabilities (TXT, BMP, PDF, JPG and CSV formats)
- Open multiple logger connections and graph files simultanously
Downloading and Communicating with your Data Logger
Set up, download and view information from a single data logger with ACR’s interface cable (included in software interface package). Connection is simple: plug the interface cable into the USB or serial port of your computer and connect the other end to the logger. No tools, cards or docking stations are required. To communicate to multiple Data Loggers or thru telemetry, see Network and Communications.
Setting up your Data Logger
With built-in menus for sample rate and mode, start delay, equations and more, logger setup is fast and easy. In addition, equations are already included for all ACR sensors so you need only select the appropriate equation from the menu or customize your own equation. Real-time readings are displayed in the in the Setup window, allowing you to verify that your logger is working correctly before placing in the field.
Viewing Data
With TrendReader® 2, data can be viewed in table or graphical format. For presentation purposes, view data in graphical format or for a more detailed analysis, view data in table format. Either way, multiple channel of data can be displayed at once. Multiple graphs can be displayed at once and compounded to create new graphs. For added presentation power, add comments, change graph colours, zoom in on specific portions of data, and display your data using custom engineering units. Print or copy and paste graphs into your reports or presentations. Select all or portions of the table and copy and paste into your favourite Windows® program.
Exporting Data
Use the export function in TrendReader® 2 to export your data to other programs for further analysis and manipulation. Data can be exported in TXT, BMP, PDF, JPG and CSV formats.
